Call sheet
| Price | 12-month target | Price upside | Forward dividend | Total return | Rating |
|---|---|---|---|---|---|
| A$5.19 | A$5.70 | 9.8% | 1.3% | 11.2% | HOLD (High Risk) |
Sources: FMP market snapshot (Data frozen 28 July 2026) · 18 May 2026 Corporate Update (pp. 1-3)

The proposed Materials sale can reset the balance sheet. The share price already reflects much of that promise; the next leg depends on completion, residual earnings and what management does with the cash.
Information date: 28 July 2026. Target horizon: 28 July 2027. Illustrative independent research prepared from public and licensed information. Forecasts and valuation are estimates, not personal investment advice or a regulated recommendation. Cover image: MAAS Group FY2025 Annual Report.
The disposal can reset the balance sheet, but the current price leaves too little room for a clean BUY while completion and reinvestment remain unresolved.
| Price | 12-month target | Price upside | Forward dividend | Total return | Rating |
|---|---|---|---|---|---|
| A$5.19 | A$5.70 | 9.8% | 1.3% | 11.2% | HOLD (High Risk) |
Sources: FMP market snapshot (Data frozen 28 July 2026) · 18 May 2026 Corporate Update (pp. 1-3)
Our 12-month target is A$5.70 after allowing for a genuine transaction-failure case and applying a 20% discount to the gross property reference. From A$5.19, the modeled total return is 11.2%, including a 7-cent ordinary-dividend assumption. That is not enough upside for a BUY, so we initiate at HOLD (High Risk).
The valuation is asymmetric. A completed sale with disciplined use of proceeds supports the base value of A$5.73, while failure to complete reduces modeled value to A$3.23. The debate is therefore less about whether the announced headline is large and more about how much cash arrives, what remains after leakage and debt, and what return MAAS earns on the capital that stays in the group.
Sources: FY2025 Annual Report (pp. 5, 13-16, 52-53, 92 and 168) · H1 FY2026 Report (pp. 2, 8-11, 23 and 30) · 18 May 2026 Corporate Update (pp. 1-3)
| Market cap | 52-week range | 90-day average volume | Target horizon | Risk |
|---|---|---|---|---|
| A$1,875m | A$3.65 - A$5.96 | 1,731,786 shares | 2027-07-28 | High |
| No. | Section | Decision use |
|---|---|---|
| 01 | Investment View | Price, target, rating and the central question |
| 02 | Investment Summary | What drives upside, what must be proven |
| 03 | Where Our View Differs | What we underwrite and what remains optionality |
| 04 | How MAAS Makes Money | Operating businesses, customers and revenue engines |
| 05 | Construction Materials Divestment | Sale terms, leakage and pro-forma balance sheet |
| 06 | Electrical and Digital Infrastructure | Secured Firmus work versus prospective pipeline |
| 07 | Civil, Property and Manufacturing | Residual portfolio economics |
| 08 | End Markets and Demand | Infrastructure, power, housing and execution cycles |
| 09 | Track Record | Growth, margins, leverage and cash conversion |
| 10 | How We Build the Forecast | Reported-to-continuing bridge and forecast formulas |
| 11 | Financial Forecasts | Revenue, EBITDA, EPS and cash flow |
| 12 | Valuation | Transaction-adjusted SOTP and cross-checks |
| 13 | Scenarios, Catalysts and Risks | Falsifiable events and quantified downside |
| 14 | Capital Allocation and Governance | Use of proceeds and stewardship |
| 15 | Sources, Methods and Disclosures | Definitions, evidence and limitations |
Sources: FY2025 Annual Report (pp. 5, 13-16, 52-53, 92 and 168) · H1 FY2026 Report (pp. 2, 8-11, 23 and 30) · 18 May 2026 Corporate Update (pp. 1-3)
The investment case comes down to three questions: does the sale complete, can the smaller group replace the lost earnings, and where does the cash go?
The proposed Construction Materials sale can turn an asset-heavy division into up to A$1.703bn of cash consideration. That is only the first step. The residual group then has to replace part of the sold earnings through civil, electrical, property and manufacturing, while the board decides how much capital is returned and how much is reinvested.
JLE gives MAAS credible exposure to power-intensive digital infrastructure, but MAAS is not a data-centre owner. The A$200m Launceston electrical contract is secured and 35% complete by value at the last update. The broader 3.3GW Firmus portfolio remains a proposal; it carries no Revenue in our base case until site-level scope is signed.
| Mechanism | Evidence at cut | Base treatment | What would change the model |
|---|---|---|---|
| Materials sale | Up to A$1.703bn; conditional | A$1.583bn upfront plus 60% of contingent consideration | Final completion accounts, tax and retained liabilities |
| Firmus contract | A$200m; 35% complete by value | Included in FY2026-27 electrical earnings | Commissioning, margin and signed follow-on scope |
| Capital allocation | Use of net proceeds not finalized | Debt paid, A$100m Firmus investment recognized, remaining cash retained | Distribution, acquisitions or new committed projects |
Sources: 18 May 2026 Corporate Update (pp. 1-3) · H1 FY2026 Report (pp. 2, 8-11, 23 and 30)
We hold FY2026 EBITDA at A$265m, the midpoint of management's A$250-280m range. That is below the provider aggregate, whose perimeter and measure definitions are not fully visible. Revenue is broadly aligned with consensus; adjusted EPS is modestly lower.
| Metric | FY2025A | H1 FY2026A | FY2026E | Current consensus | Difference |
|---|---|---|---|---|---|
| Underlying Revenue | A$997.4m | A$607.7m | A$1,370.0m | A$1,371.5m | -0.1% |
| Underlying EBITDA | A$219.4m | A$115.3m | A$265.0m | A$309.8m | -14.5% |
| Adjusted EPS | A$0.227 | A$0.112 | A$0.268 | A$0.282 | -4.7% |
Sources: FY2025 Annual Report (pp. 5, 13-16, 52-53, 92 and 168) · H1 FY2026 Report (pp. 2, 8-11, 23 and 30) · 18 May 2026 Corporate Update (pp. 1-3) · FMP market snapshot (Data frozen 28 July 2026)
The easy bull case adds gross sale proceeds to a growing AI-infrastructure story. It ignores tax and transaction leakage, debt repayment, the A$100m Firmus investment and the fact that proposed sites are not contracts. The easy bear case treats MAAS as a slower contractor and gives little credit for asset conversion or JLE's electrical capability.
Our middle ground is less exciting but more defensible: the transaction reduces financing risk and increases capital-allocation risk. A higher-quality multiple has to be earned through signed electrical work, cash conversion and disciplined recycling of property and sale proceeds.
Sources: 18 May 2026 Corporate Update (pp. 1-3) · FY2025 Annual Report (pp. 5, 13-16, 52-53, 92 and 168)
Sources: FY2025 Annual Report (pp. 5, 13-16, 52-53, 92 and 168) · H1 FY2026 Report (pp. 2, 8-11, 23 and 30)
We give credit for signed work and net proceeds, but not for gross consideration or a proposed 3.3GW pipeline.
The A$1.703bn headline is an upper bound: A$1.583bn upfront and A$120m contingent. Our completion case recognizes 60% of the contingent amount and deducts 8.5% for tax, fees, working-capital and retained-liability leakage. That produces A$1.514bn of modeled net proceeds and A$775m of pro-forma net cash after H1 net debt and the post-balance-date Firmus investment.
The report now carries a separate no-deal case worth A$3.23. It assumes no sale proceeds, keeps the current group together, values FY2026 EBITDA at 7.0x and deducts adjusted net debt. This is a materially different economic state, rather than a completed transaction with slightly worse terms.
Sources: 18 May 2026 Corporate Update (pp. 1-3) · H1 FY2026 Report (pp. 2, 8-11, 23 and 30)
The A$200m Launceston contract is the only disclosed Firmus award that enters our base revenue path. Its 35% completion by value gives a measurable checkpoint and management expects calendar-2026 delivery and commissioning. The company also states an indicative A$200m of electrical revenue per 100MW for future projects, but that unit rate does not convert the proposed 3.3GW portfolio into A$6.6bn of backlog.
We require site-level scope, binding value, delivery timing and economics before adding a follow-on project. This discipline matters because electrical contracting can generate substantial revenue while still producing modest value if project risk, working capital and commissioning liabilities are poorly controlled.
Sources: 18 May 2026 Corporate Update (pp. 1-3) · JLE official page (Company profile and capabilities)
| Claim | Confirming evidence | Falsifying evidence |
|---|---|---|
| Sale de-risks the balance sheet | Settlement and transparent net proceeds | Delay, break, or materially higher leakage |
| Electrical becomes a higher-quality growth engine | Commissioning, margin and repeat signed scope | Revenue without cash conversion or repeat awards |
| Property is a source of realizable NAV | Settlements and asset recycling near carrying values | Write-downs, slow inventory and weak cash realization |
| Capital allocation creates value | Returns above hurdle rates or distributions | Acquisitions or projects below cost of capital |
Sources: 18 May 2026 Corporate Update (pp. 1-3) · H1 FY2026 Report (pp. 2, 8-11, 23 and 30) · FY2025 Annual Report (pp. 5, 13-16, 52-53, 92 and 168)
| Window | Expected event | Model compartment |
|---|---|---|
| August 2026 | FY2026 result and FY2027 guidance | Revenue, EBITDA, EPS and continuing perimeter |
| Q3-Q4 CY2026 | Heidelberg settlement | Net cash and SOTP |
| CY2026 | Launceston commissioning | Electrical revenue and margin |
| FY2027 | Use of sale proceeds | Net cash, growth capex and target multiple |
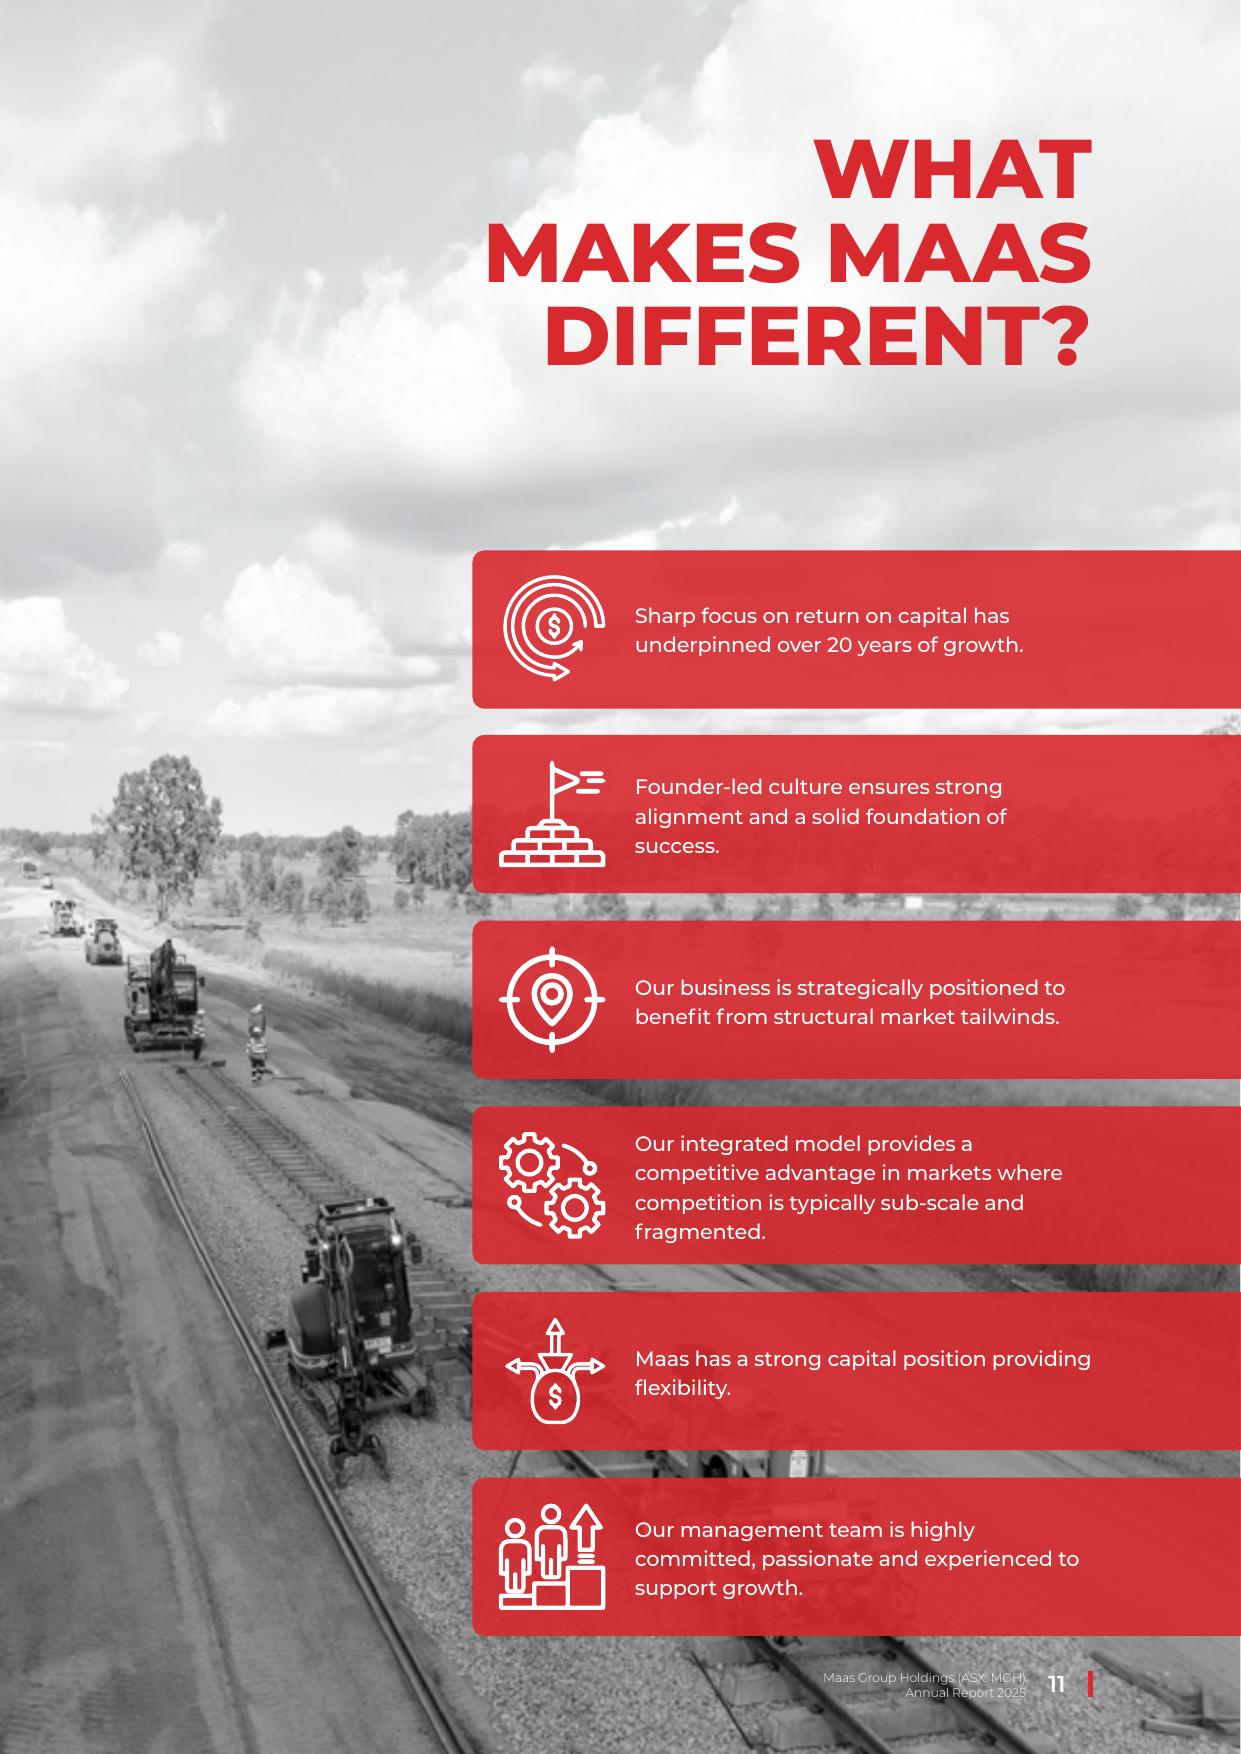
MAAS is a portfolio of materials, project delivery, property and equipment businesses whose economic drivers differ materially.
The FY2025 reporting structure comprised Construction Materials, Civil Construction and Hire, Residential Real Estate, Commercial Real Estate, and Manufacturing. Construction Materials supplied quarry, concrete, crushing, geotechnical and asphalt services. Civil combined infrastructure delivery, equipment hire and electrical services. The property divisions developed and recycled residential and commercial assets; Manufacturing sold and hired underground equipment.
This mix makes consolidated Revenue a poor standalone indicator. Commercial Real Estate generated A$50.7m of FY2025 underlying EBITDA, but A$38.3m came from fair-value gains. Civil Revenue declined in FY2025 as projects rolled off, while Materials grew through acquisitions. The quality and cash conversion of each dollar therefore differs by segment.
Sources: FY2025 Annual Report (pp. 5, 13-16, 52-53, 92 and 168)
Sources: FY2025 Annual Report (pp. 5, 13-16, 52-53, 92 and 168) · H1 FY2026 Report (pp. 2, 8-11, 23 and 30)
| Segment | Core output | Primary demand | Key financial issue |
|---|---|---|---|
| Construction Materials | Aggregates, concrete, asphalt, geotechnical | Infrastructure and construction | Pending sale; high asset intensity |
| Civil and Hire | Civil delivery, equipment, electrical | Renewables, mining, utilities, digital infrastructure | Project timing, utilization and contract risk |
| Residential | Land and housing | Regional migration, housing supply, rates | Settlement timing and inventory |
| Commercial | Industrial, childcare, self-storage and construction | Tenant demand and capitalization rates | Fair-value gains versus cash realization |
| Manufacturing | Underground mining equipment and parts | Mining capex and export demand | Tariffs, distribution and cyclicality |
Sources: FY2025 Annual Report (pp. 5, 13-16, 52-53, 92 and 168) · H1 FY2026 Report (pp. 2, 8-11, 23 and 30)
This is a decision-focused view of the current company twin, not the full database graph. It selects the accepted relationships that explain what MAAS sells, which customer groups it serves, how JLE reaches the Firmus AI-infrastructure opportunity, and which operating mechanisms matter to Revenue, EBITDA, cash and valuation.
The structure reveals three different economic systems inside one listed company: asset-heavy materials and civil activity, property inventory and valuation exposure, and a contract-led electrical growth platform. The proposed Materials sale changes the portfolio perimeter; it does not by itself prove that the smaller residual company will earn higher returns.
Sources: FY2025 Annual Report (pp. 5, 13-16, 52-53, 92 and 168) · H1 FY2026 Report (pp. 2, 8-11, 23 and 30) · 18 May 2026 Corporate Update (pp. 1-3) · JLE official page (Company profile and capabilities)
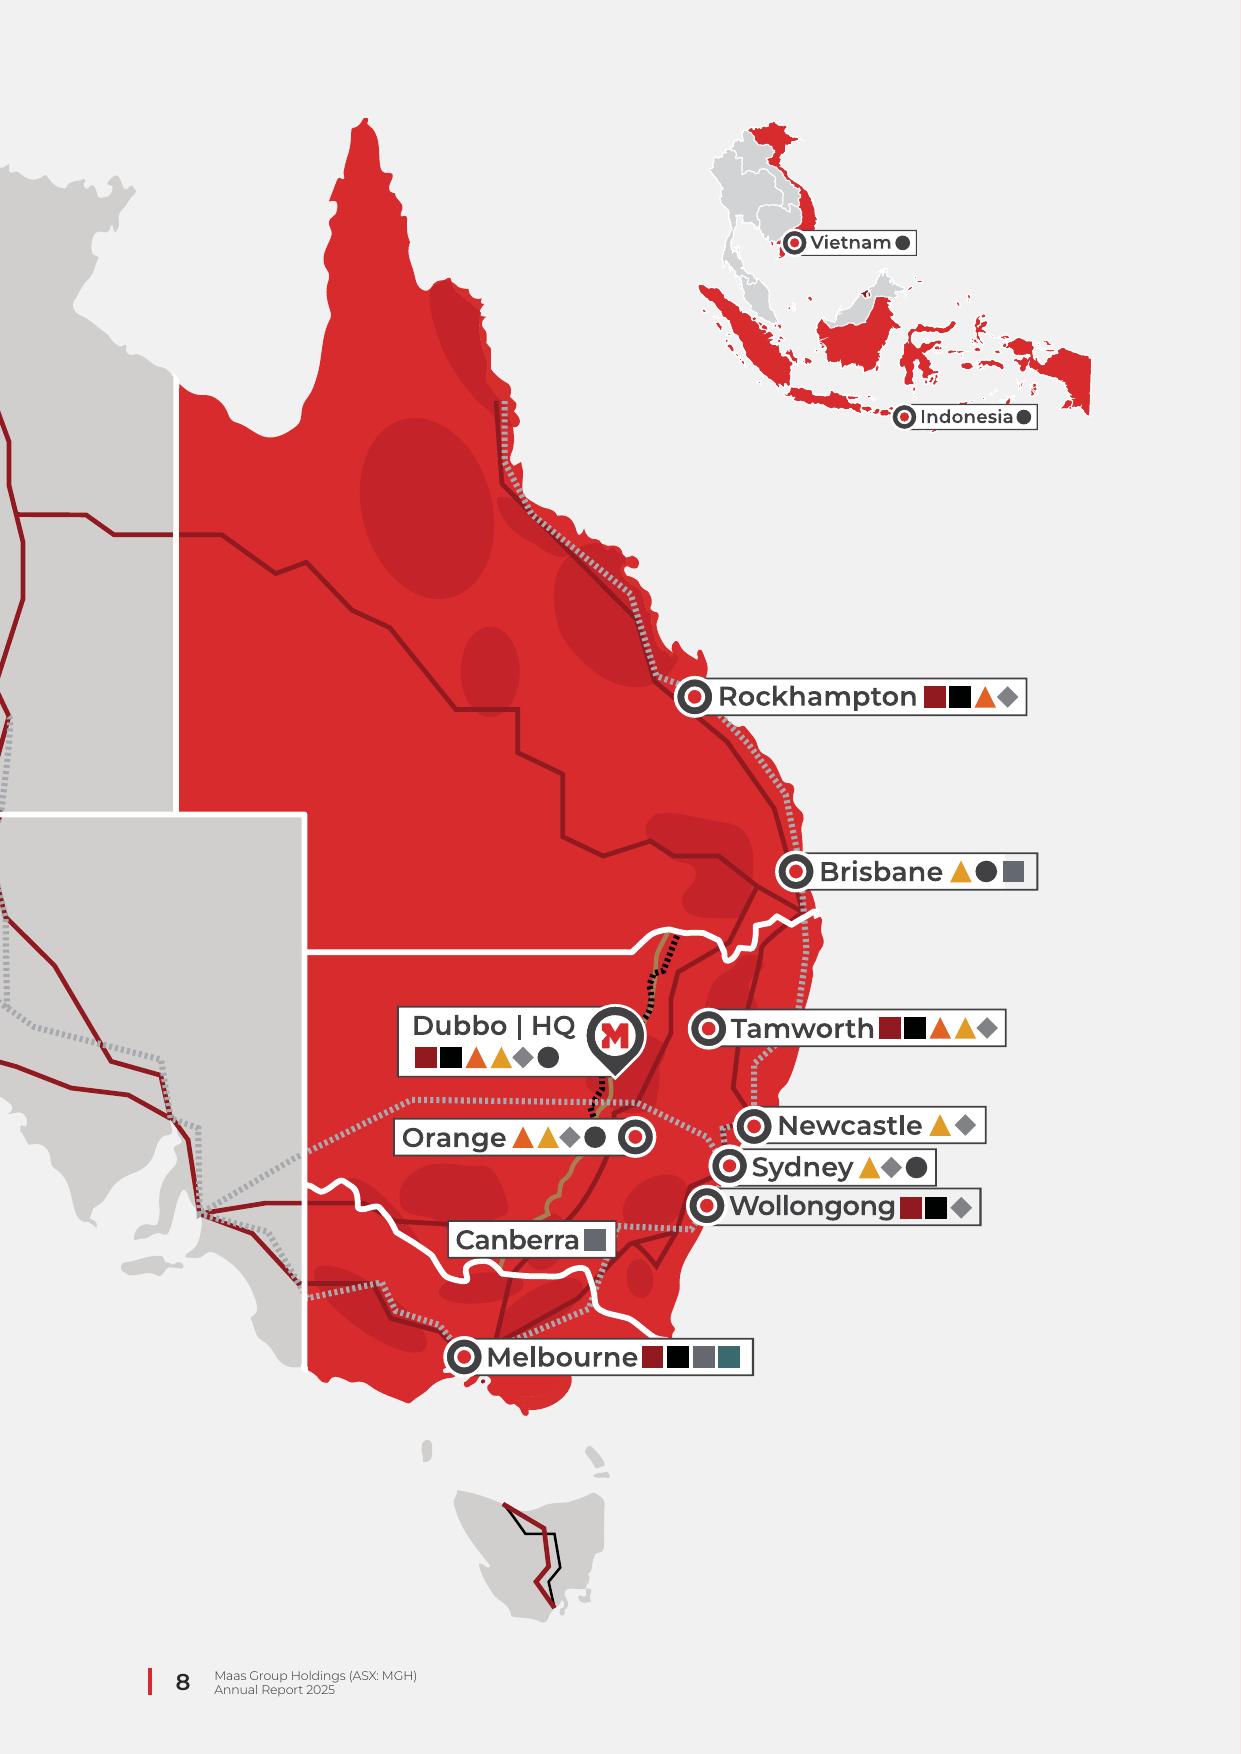
MAAS remains primarily an Australian operator, with its main activities concentrated along the east coast and regional infrastructure corridors. FY2025 foreign Revenue of A$29.1m related to underground equipment and toll manufacturing across a diversified group of countries; no individual foreign country was material.
The geographic concentration supports local operating familiarity but leaves earnings exposed to Australian infrastructure schedules, weather, housing conditions and interest rates. It also means that the Construction Materials sale is a substantial portfolio reset rather than a minor asset disposal.
Sources: FY2025 Annual Report (pp. 5, 13-16, 52-53, 92 and 168)
The proposed sale is the dominant valuation event. Our model separates transaction facts from completion assumptions and reinvestment judgment.
| Term | Disclosed amount/status | Model treatment |
|---|---|---|
| Upfront cash consideration | A$1.583bn | 100% included |
| Contingent consideration | Up to A$120m | 60% probability in base |
| Total consideration | Up to A$1.703bn | Upper bound only |
| Expected settlement | Q3 or Q4 CY2026 | 31 October 2026 base timing |
| Approvals | Conditions and regulatory workstreams progressing | Not treated as completed |
Sources: 18 May 2026 Corporate Update (pp. 1-3) · H1 FY2026 Report (pp. 2, 8-11, 23 and 30)
| Item | A$m | Classification |
|---|---|---|
| Upfront cash consideration | 1,583.0 | sourced fact |
| Probability-weighted contingent consideration | 72.0 | forecast assumption |
| Transaction, tax and fee leakage | -140.7 | forecast assumption |
| Estimated net sale proceeds | 1,514.3 | derived calculation |
| H1 FY2026 underlying net debt | -639.6 | sourced fact |
| Post-balance-date Firmus investment | -100.0 | sourced fact |
| Pro-forma post-sale net cash | 774.7 | derived calculation |
Sources: 18 May 2026 Corporate Update (pp. 1-3) · H1 FY2026 Report (pp. 2, 8-11, 23 and 30)
If settlement occurs during FY2027, the statutory presentation may classify Construction Materials as discontinued operations and remove its Revenue from continuing operations even though several months of trading occurred. Current provider consensus may reflect a different convention. We therefore publish three fields: continuing Revenue, disposed Materials Revenue and group underlying Revenue.
This is not cosmetic. A declining headline Revenue series after the sale can coexist with higher per-share value if proceeds exceed the disposed business's value and capital is allocated well. Conversely, Revenue growth can mask value destruction if it is bought with the proceeds at weak returns.
Sources: 18 May 2026 Corporate Update (pp. 1-3) · FMP market snapshot (Data frozen 28 July 2026)
| Use | Value-positive condition | Principal risk |
|---|---|---|
| Debt reduction | Reduces financial risk and interest expense | Temporary benefit if leverage is rebuilt |
| Shareholder distribution | Returns excess cash without impairing growth | Foregoes high-return opportunities |
| Electrical growth | Signed contracts earn returns above the cost of capital | Pipeline is mistaken for backlog |
| Property development | Cash margins and cycle times compensate for capital intensity | Inventory and valuation risk |
| Acquisitions | Synergies and returns are evidenced before deployment | Repeats leverage-led portfolio expansion |
Sources: 18 May 2026 Corporate Update (pp. 1-3) · FY2025 Annual Report (pp. 5, 13-16, 52-53, 92 and 168)
JLE provides a credible route into power-intensive infrastructure, but the forecast recognizes contracts, not megawatt headlines.
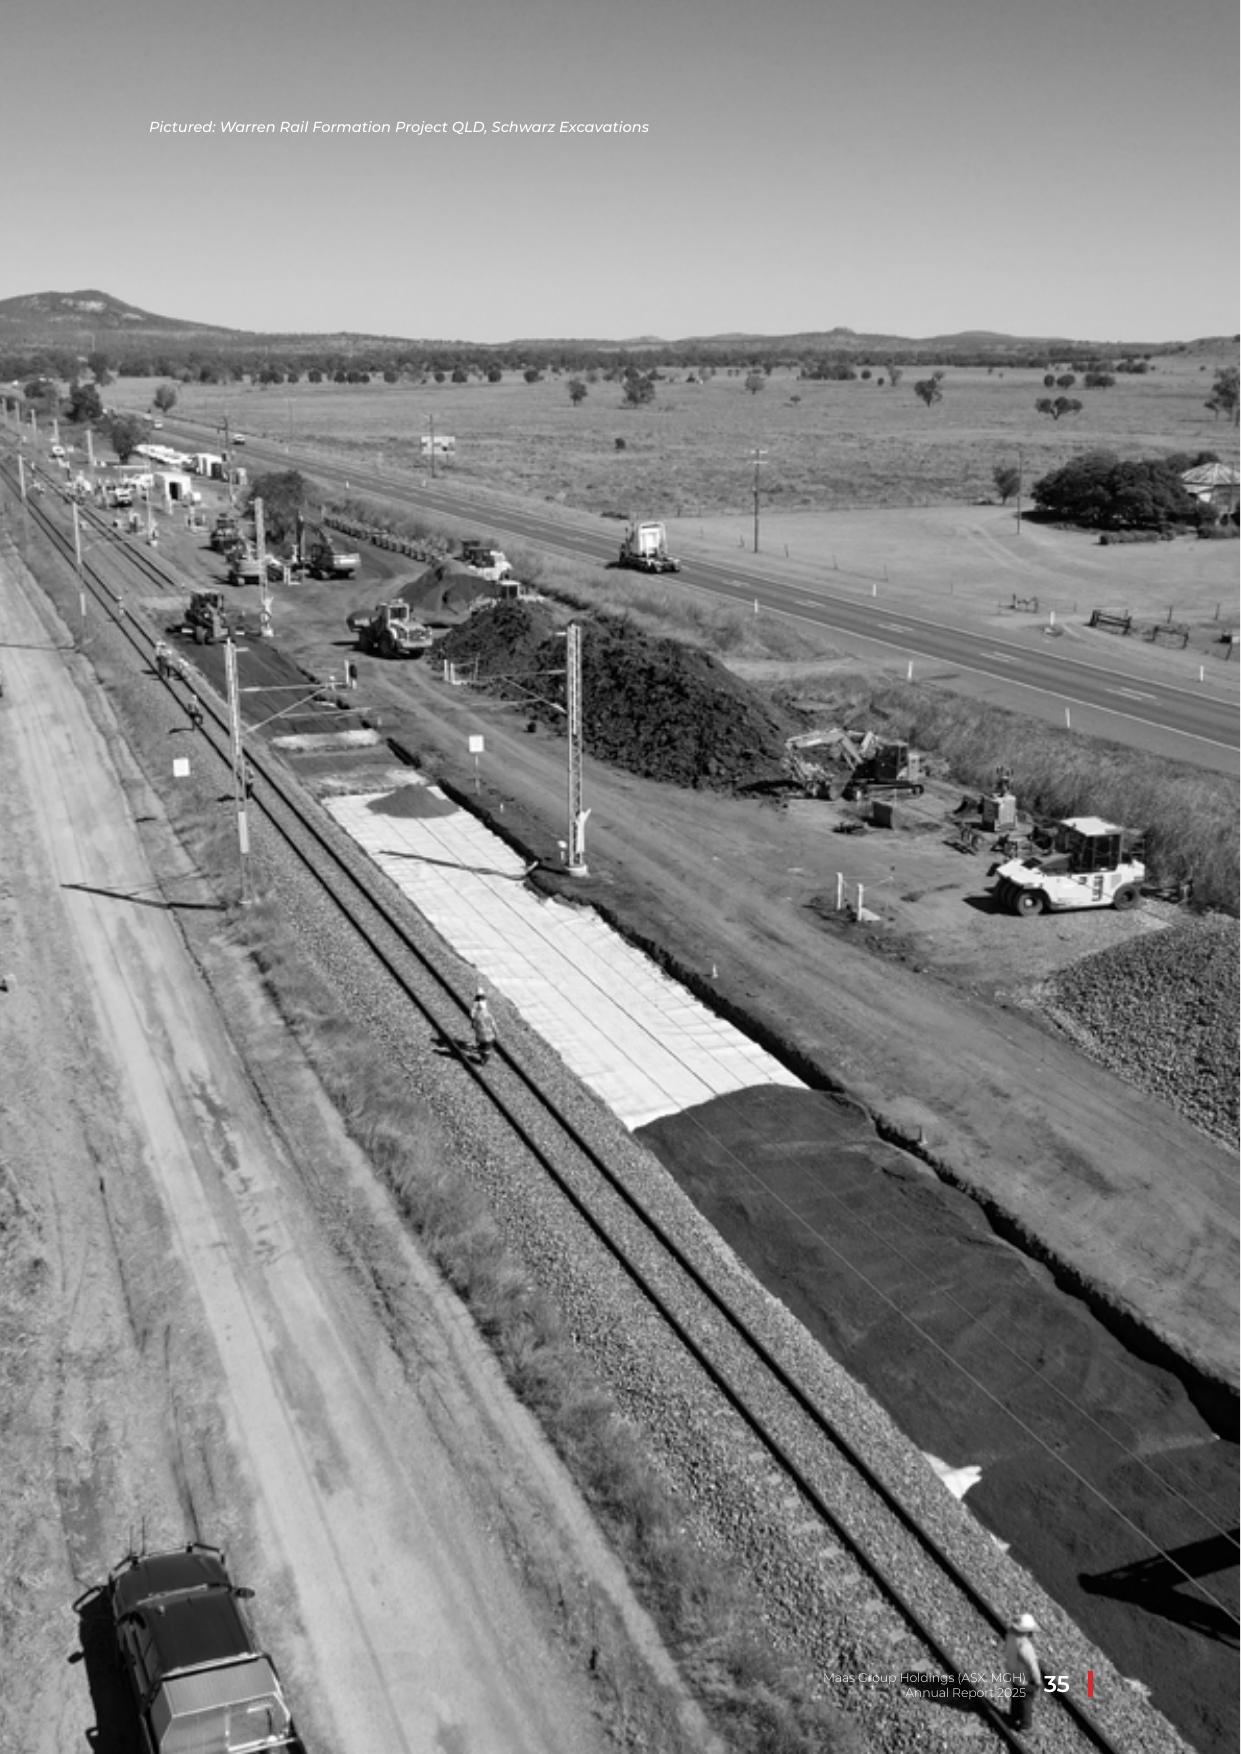
JLE sits within Civil Construction and Hire and provides electrical infrastructure, transmission and distribution, communications and specialized services. For data centres and AI factories, MAAS describes a complete electrical powertrain capability spanning grid connection, high-voltage substations and switchyards, transformers, switchgear, testing, commissioning and standby generation.
This is an enabling-infrastructure exposure. MAAS is not underwriting GPU demand directly and does not control the Firmus data-centre platform. Earnings depend on contracted scope, project delivery, margin discipline and working-capital conversion.
Sources: FY2025 Annual Report (pp. 5, 13-16, 52-53, 92 and 168) · 18 May 2026 Corporate Update (pp. 1-3) · JLE official page (Company profile and capabilities)
| Measure | Disclosed fact | Forecast relevance |
|---|---|---|
| Contract value | A$200m | Included across FY2026-27 delivery |
| Capacity | 100MW | Project scale, not a valuation unit by itself |
| Progress at May 2026 | Approximately 35% by value | Supports near-term Revenue recognition |
| Delivery | Calendar 2026 | Commissioning is the next proof point |
| Division | JLE electrical | Affects Civil and Hire segment economics |
Management has described an exclusive electrical delivery partnership for Firmus's proposed 3.3GW Australian AI Factory portfolio and an indicative A$200m of Revenue per 100MW. Multiplying those two statements produces A$6.6bn, but that is not an acceptable forecast. It assumes every proposed site proceeds, MAAS retains identical scope, pricing does not change and execution capacity is unlimited.
Our base case adds no unnamed follow-on site. Additional Revenue enters only after a binding award with a disclosed value or sufficiently specific scope. The proposed pipeline remains an upside catalyst and helps justify the bull-case multiple, but it is not part of base backlog.
| Driver | Revenue effect | Margin effect | Cash effect |
|---|---|---|---|
| Contract award | Adds signed scope over delivery period | Depends on pricing and risk allocation | May require bonding and working capital |
| Manufacturing progress | Revenue recognized progressively | Factory utilization can improve | Inventory and supplier payments precede collection |
| Commissioning delay | Defers milestones | Delay costs can compress margin | Receivables and contract assets may rise |
| Repeat sites | Extends duration and scale | Learning can improve execution | Capacity and capital requirements increase |
Sources: 18 May 2026 Corporate Update (pp. 1-3) · H1 FY2026 Report (pp. 2, 8-11, 23 and 30)
The residual group is diversified, but diversification is valuable only if accounting earnings convert into cash.
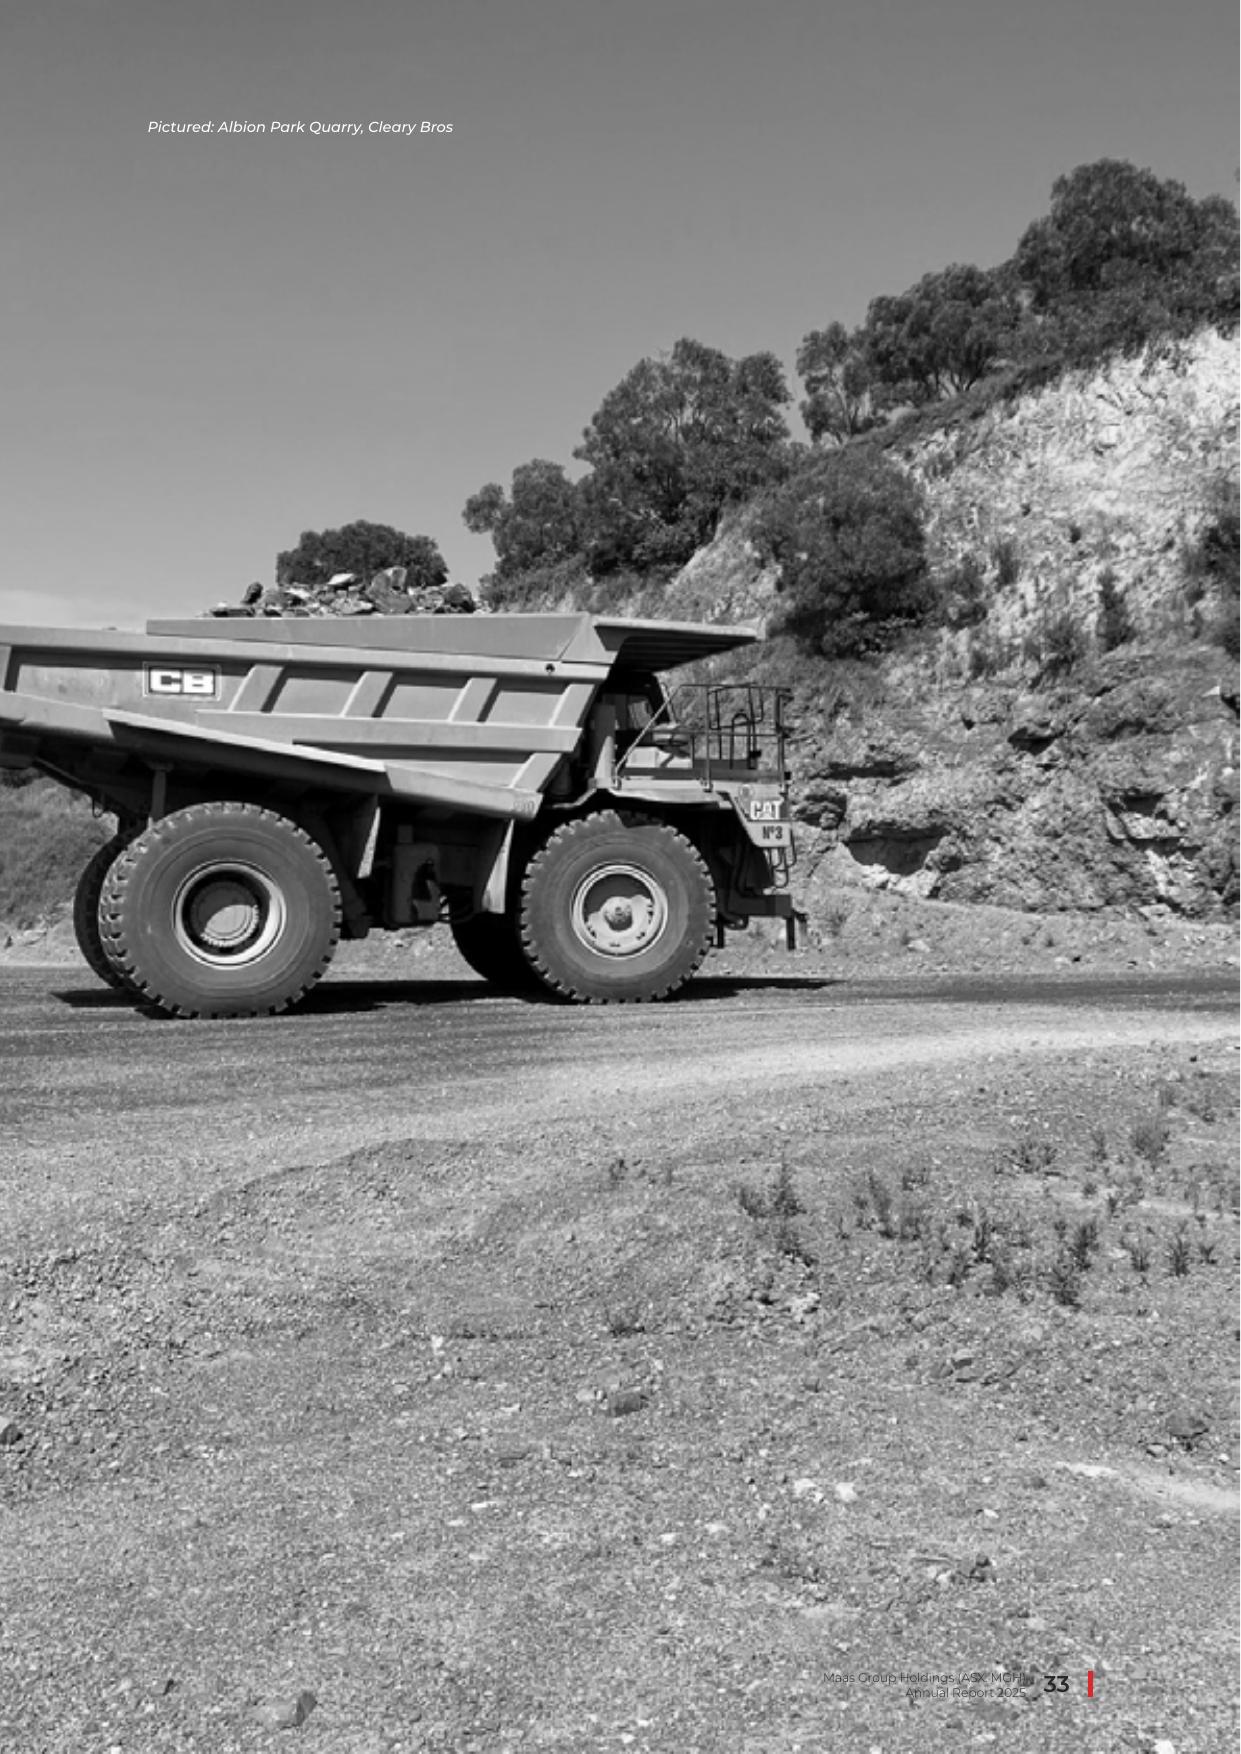
Civil and Hire FY2025 Revenue fell 5.5% and underlying EBITDA fell 35.0% as higher-margin projects rolled off, replacement work was delayed and isolated projects incurred losses. H1 FY2026 Revenue then rose with electrical representing 20.5% of segment mix. The base forecast assumes Firmus and renewable/infrastructure work restore margins, but not to the point where contracting risk disappears.
Our FY2027 continuing model assigns A$560m Revenue and A$105m EBITDA to Civil and electrical activities. That is the largest residual earnings component and therefore the key input into the OpCo multiple.
Sources: FY2025 Annual Report (pp. 5, 13-16, 52-53, 92 and 168) · H1 FY2026 Report (pp. 2, 8-11, 23 and 30) · 18 May 2026 Corporate Update (pp. 1-3)
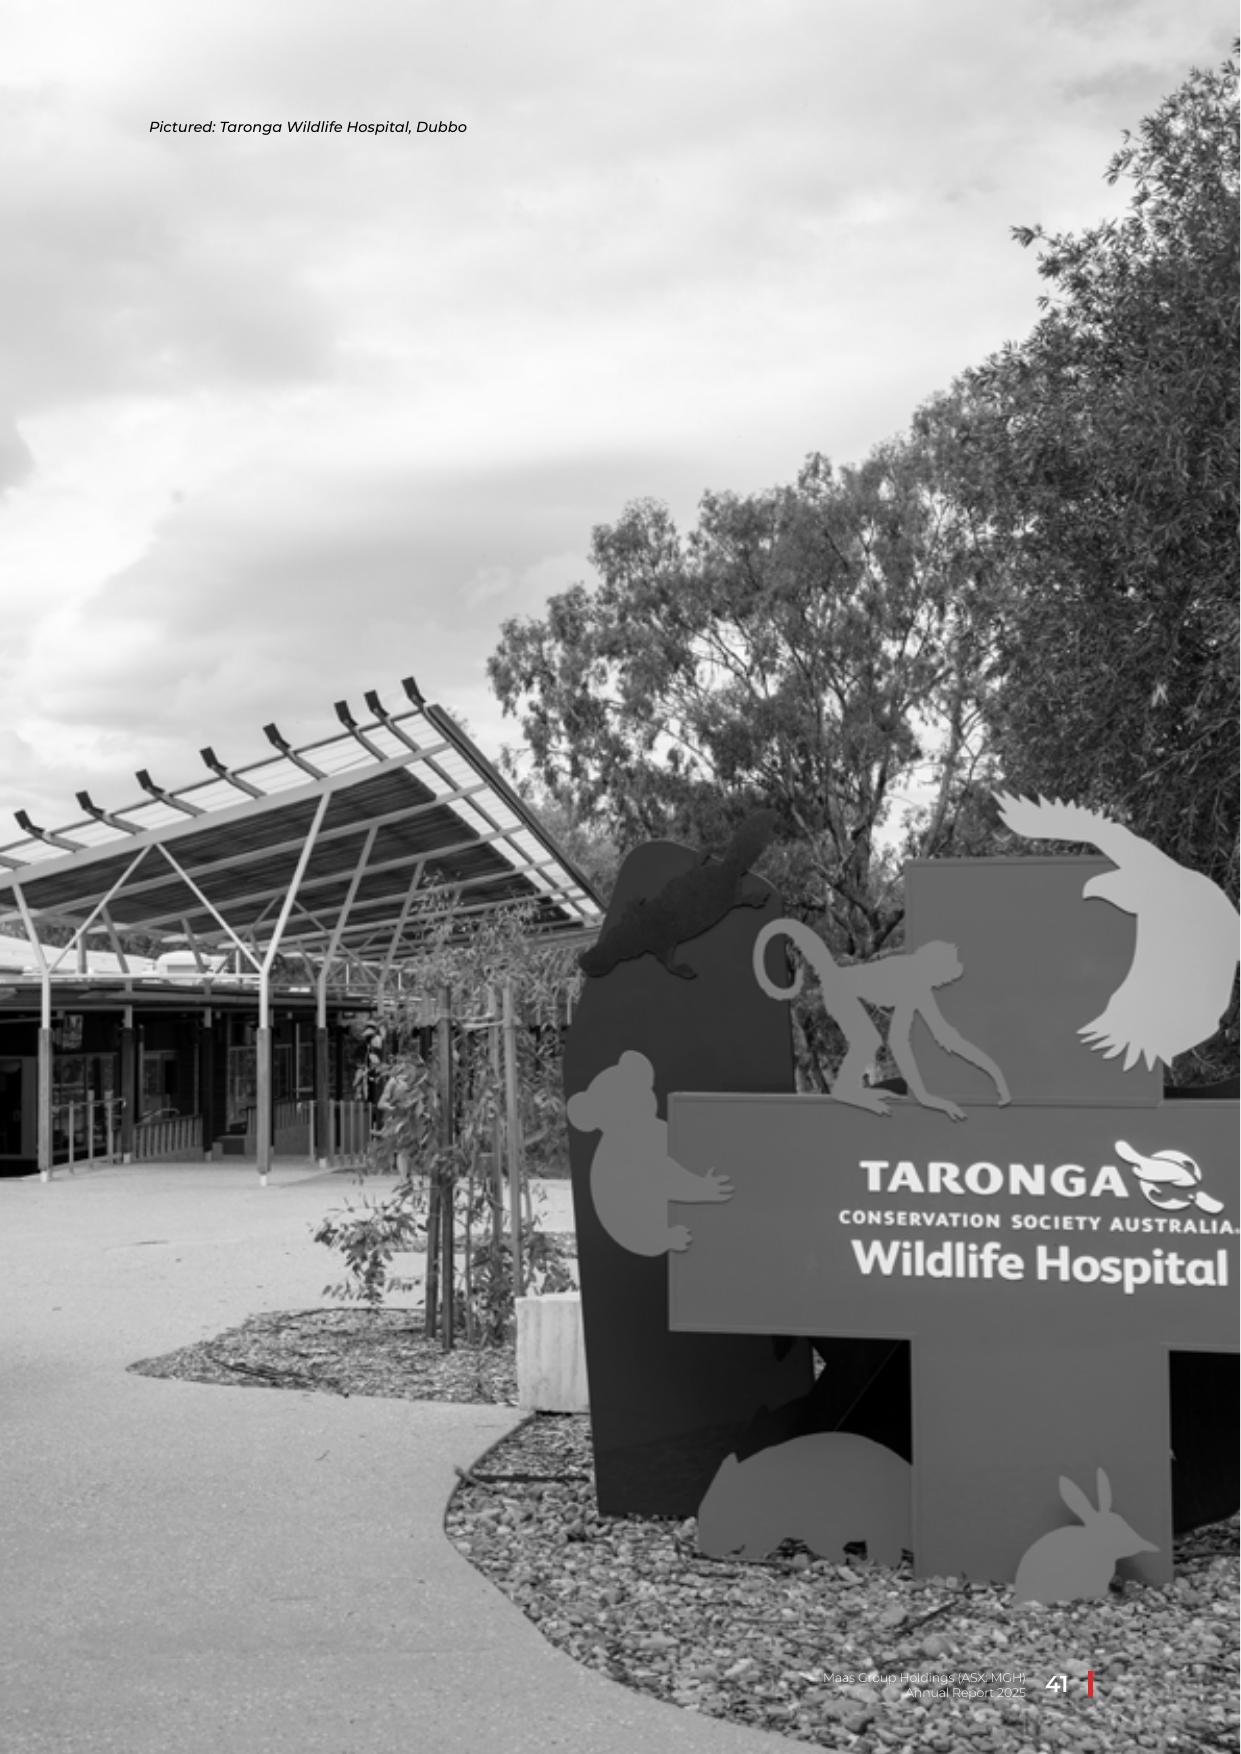
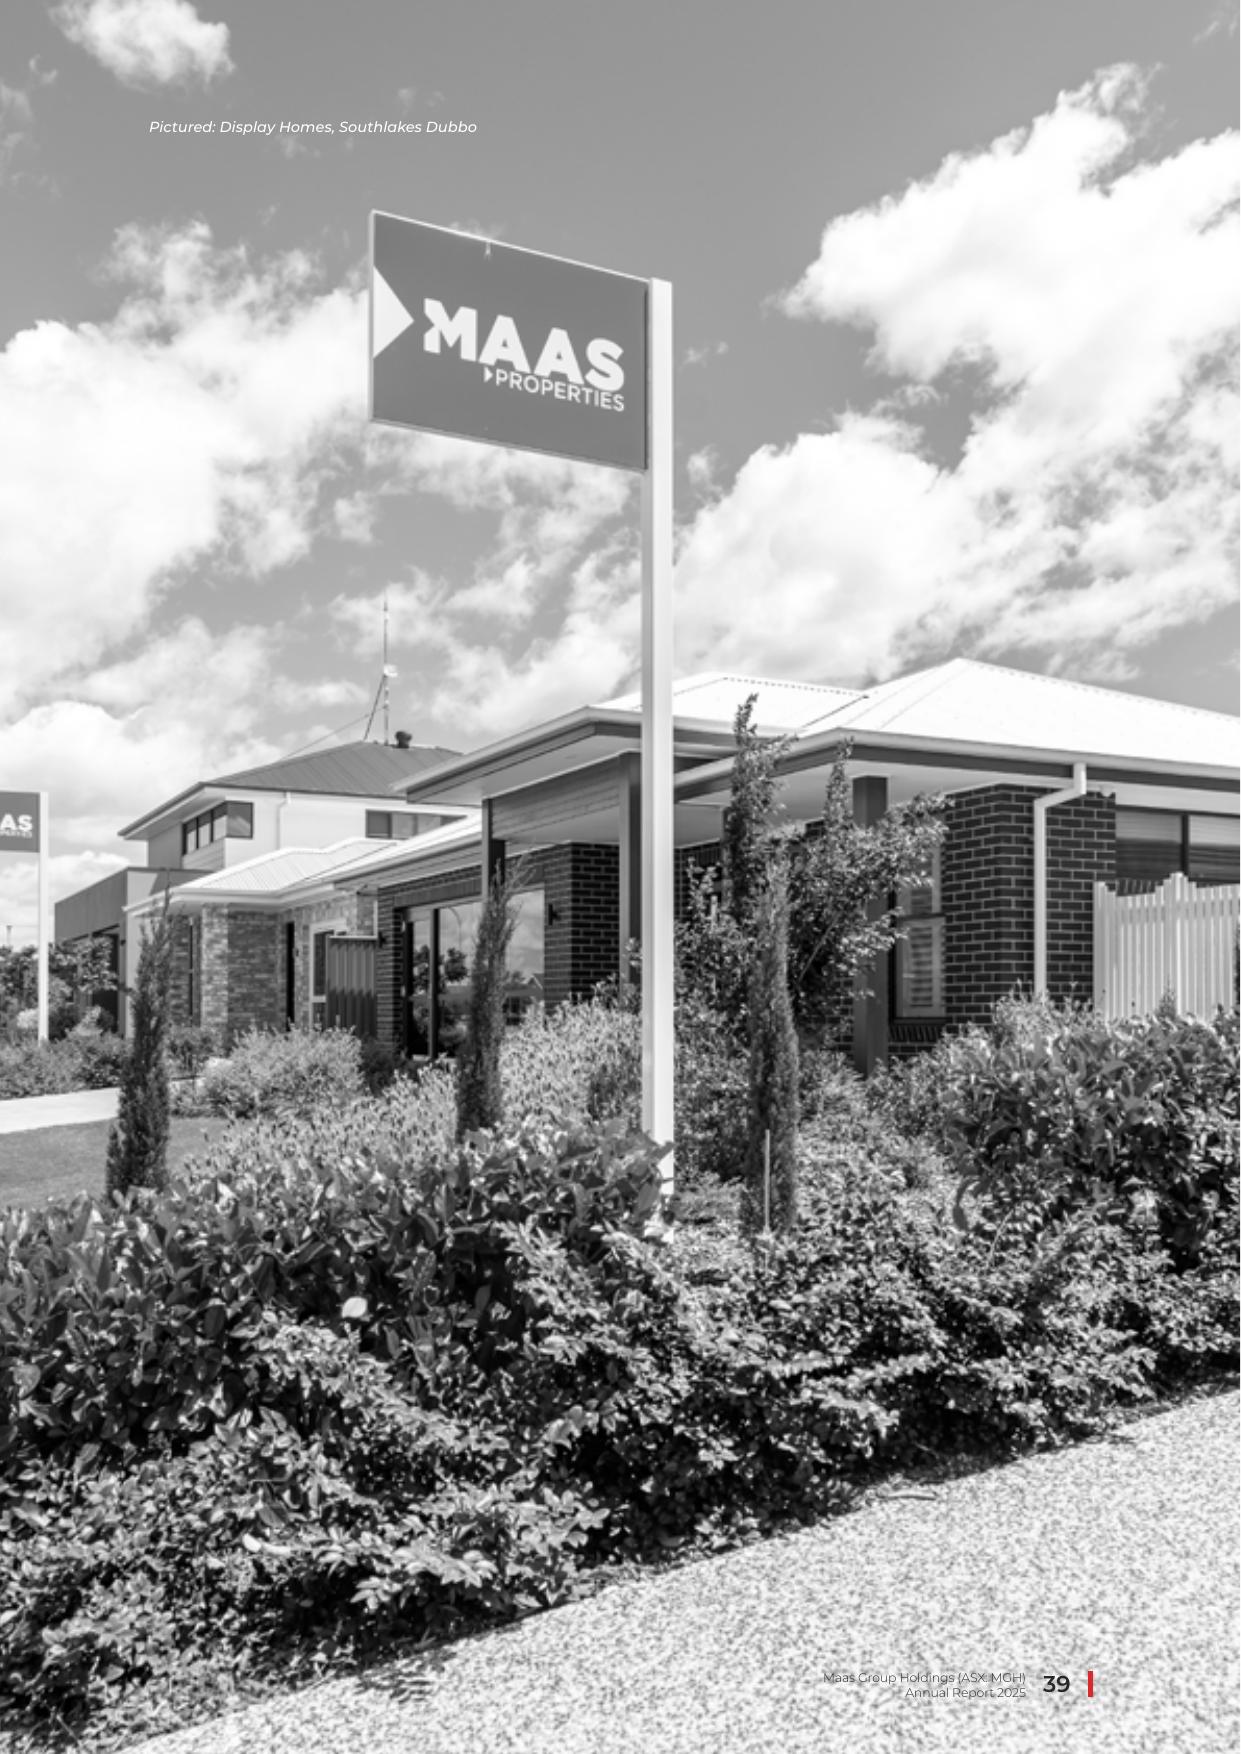
FY2025 Commercial Real Estate underlying EBITDA was A$50.7m, but A$38.3m came from fair-value gains. H1 FY2026 included another A$19.1m of fair-value gains. These amounts can reflect genuine development progress, yet they are not equivalent to cash receipts and should not be capitalized as recurring contractor earnings.
We therefore value Residential and Commercial primarily through a discounted gross accounting reference of A$598.8m, consisting of investment properties, properties held for sale and inventories at H1 FY2026. It is not a project-level NAV: associated debt, tax, remaining construction costs and settlement risk are not fully disclosed. The base case applies a 20% discount, while the favourable case applies 10%.
Sources: FY2025 Annual Report (pp. 5, 13-16, 52-53, 92 and 168) · H1 FY2026 Report (pp. 2, 8-11, 23 and 30)
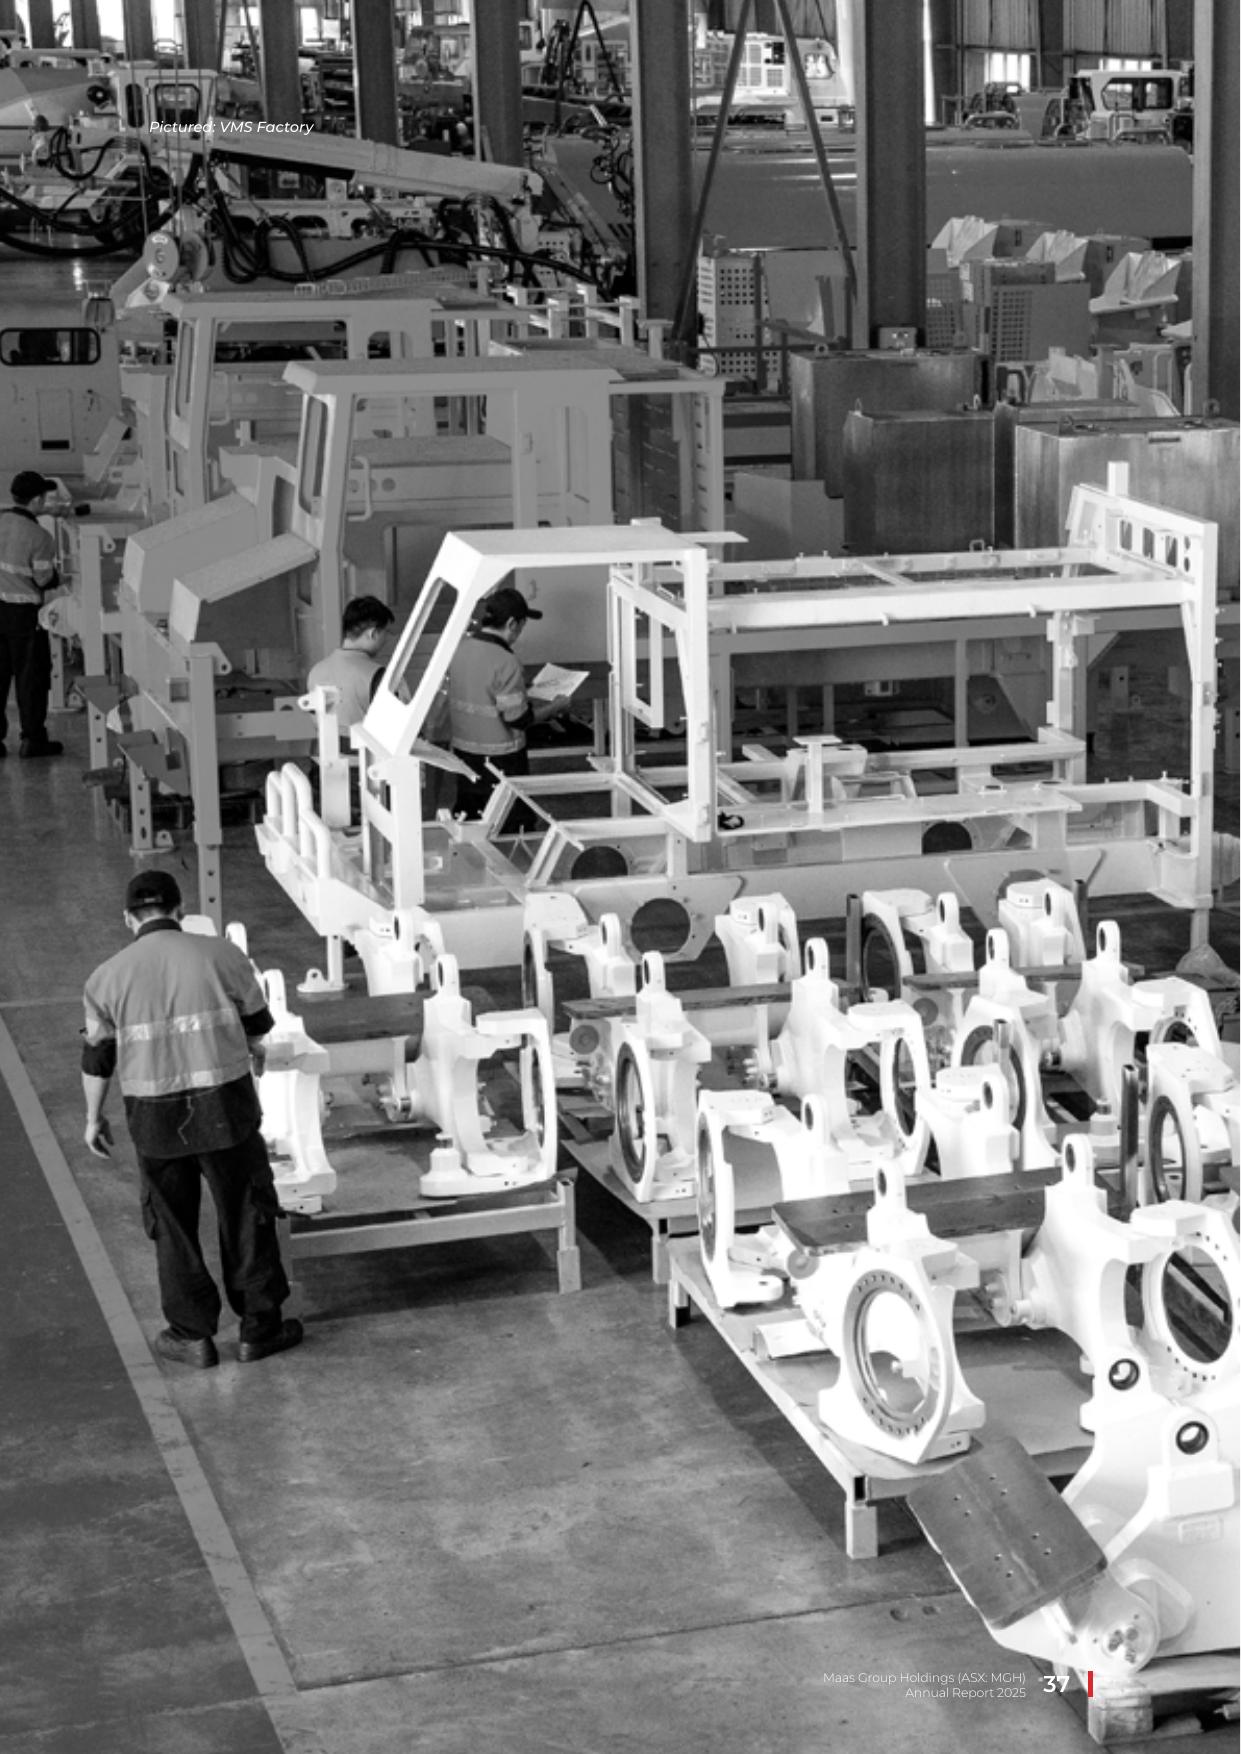
Manufacturing generated A$33.6m of FY2025 underlying Revenue and A$5.1m EBITDA, with improved machine sales and hire activity. The business sells underground equipment and parts through international distribution networks. It is a small contributor to group value, but offers a distinct mining-capex exposure.
The annual report also identifies tariffs and global trade instability as risks. We model the segment conservatively at A$38m FY2027 Revenue and A$6m EBITDA, with no strategic premium.
Sources: FY2025 Annual Report (pp. 5, 13-16, 52-53, 92 and 168)
| Measure | FY2025/H1 FY2026 fact | What matters next |
|---|---|---|
| Residential lots | 201 FY2025 settlements; 80 H1 FY2026 settlements | Settlement pace and gross margin |
| Commercial fair-value gains | A$38.3m FY2025; A$19.1m H1 FY2026 | Cash realization and external valuation support |
| Investment properties | A$278.3m at H1 FY2026 | Cap rates, completion and disposals |
| Inventories | A$281.2m current plus non-current | Development spend and cash conversion |
Sources: FY2025 Annual Report (pp. 5, 13-16, 52-53, 92 and 168) · H1 FY2026 Report (pp. 2, 8-11, 23 and 30)
MAAS is exposed to several cycles at once: public infrastructure, power investment, housing, property capitalization rates and project execution.
Infrastructure Australia estimates A$1.14tn of construction activity over five years, including a A$242bn major public infrastructure pipeline. ABS data for the March 2026 quarter also showed engineering construction work rising 6.9% nationally; in South Australia, total engineering work done rose 7.1% quarter on quarter. The opportunity pool is clearly large.
Those figures are demand context, not MAAS backlog. Contract timing drives utilization, contract structure determines margin volatility, and working-capital terms determine whether EBITDA becomes cash. Our base case includes the signed Firmus scope and a measured recovery from FY2025 delays; it does not convert public infrastructure plans into company awards.
Sources: Infrastructure Australia 2025 Market Capacity Report (National five-year activity and public infrastructure pipeline) · ABS Construction Work Done, March 2026 (Key statistics) · ABS Engineering Construction Activity, March 2026 (South Australia and national work done) · FY2025 Annual Report (pp. 5, 13-16, 52-53, 92 and 168)
AI infrastructure increases demand for grid connections, substations, switchgear, transformers and commissioning. That creates a relevant end market for JLE's capabilities. The investment thesis is strongest where demand becomes binding electrical scope, not where industry megawatts are discussed without a contract.
The first-order forecast variables are signed contract value, completion percentage, margin and cash collection. Electricity demand, data-centre announcements and GPU deployments are secondary indicators that help explain opportunity formation but do not enter Revenue directly.
Sources: 18 May 2026 Corporate Update (pp. 1-3) · JLE official page (Company profile and capabilities) · AEMO 2026 Integrated System Plan (Network investment roadmap)
The RBA cash-rate target was 4.35% at the research cut. May 2026 approvals were mixed: private houses rose 2.8% month on month, while private dwellings excluding houses fell 10.4%. That is consistent with a market where funding costs and product mix matter more than a single national housing headline.
For MAAS, lot readiness, buyer mix, settlement timing and local demand determine conversion. We therefore use rates and approvals as scenario context, not as a mechanical multiplier on Revenue or property value.
Sources: RBA cash-rate target (Rate effective 17 June 2026) · ABS Building Approvals, May 2026 (May 2026 key statistics) · FY2025 Annual Report (pp. 5, 13-16, 52-53, 92 and 168)
Construction Materials and civil operations are exposed to adverse weather, project delay, fixed-cost utilization and input-cost inflation. Manufacturing adds tariff and trade-policy risk. These mechanisms can affect Revenue timing, margin and cash simultaneously, which is why the risk section quantifies EBITDA and NAV sensitivities rather than only listing qualitative risks.
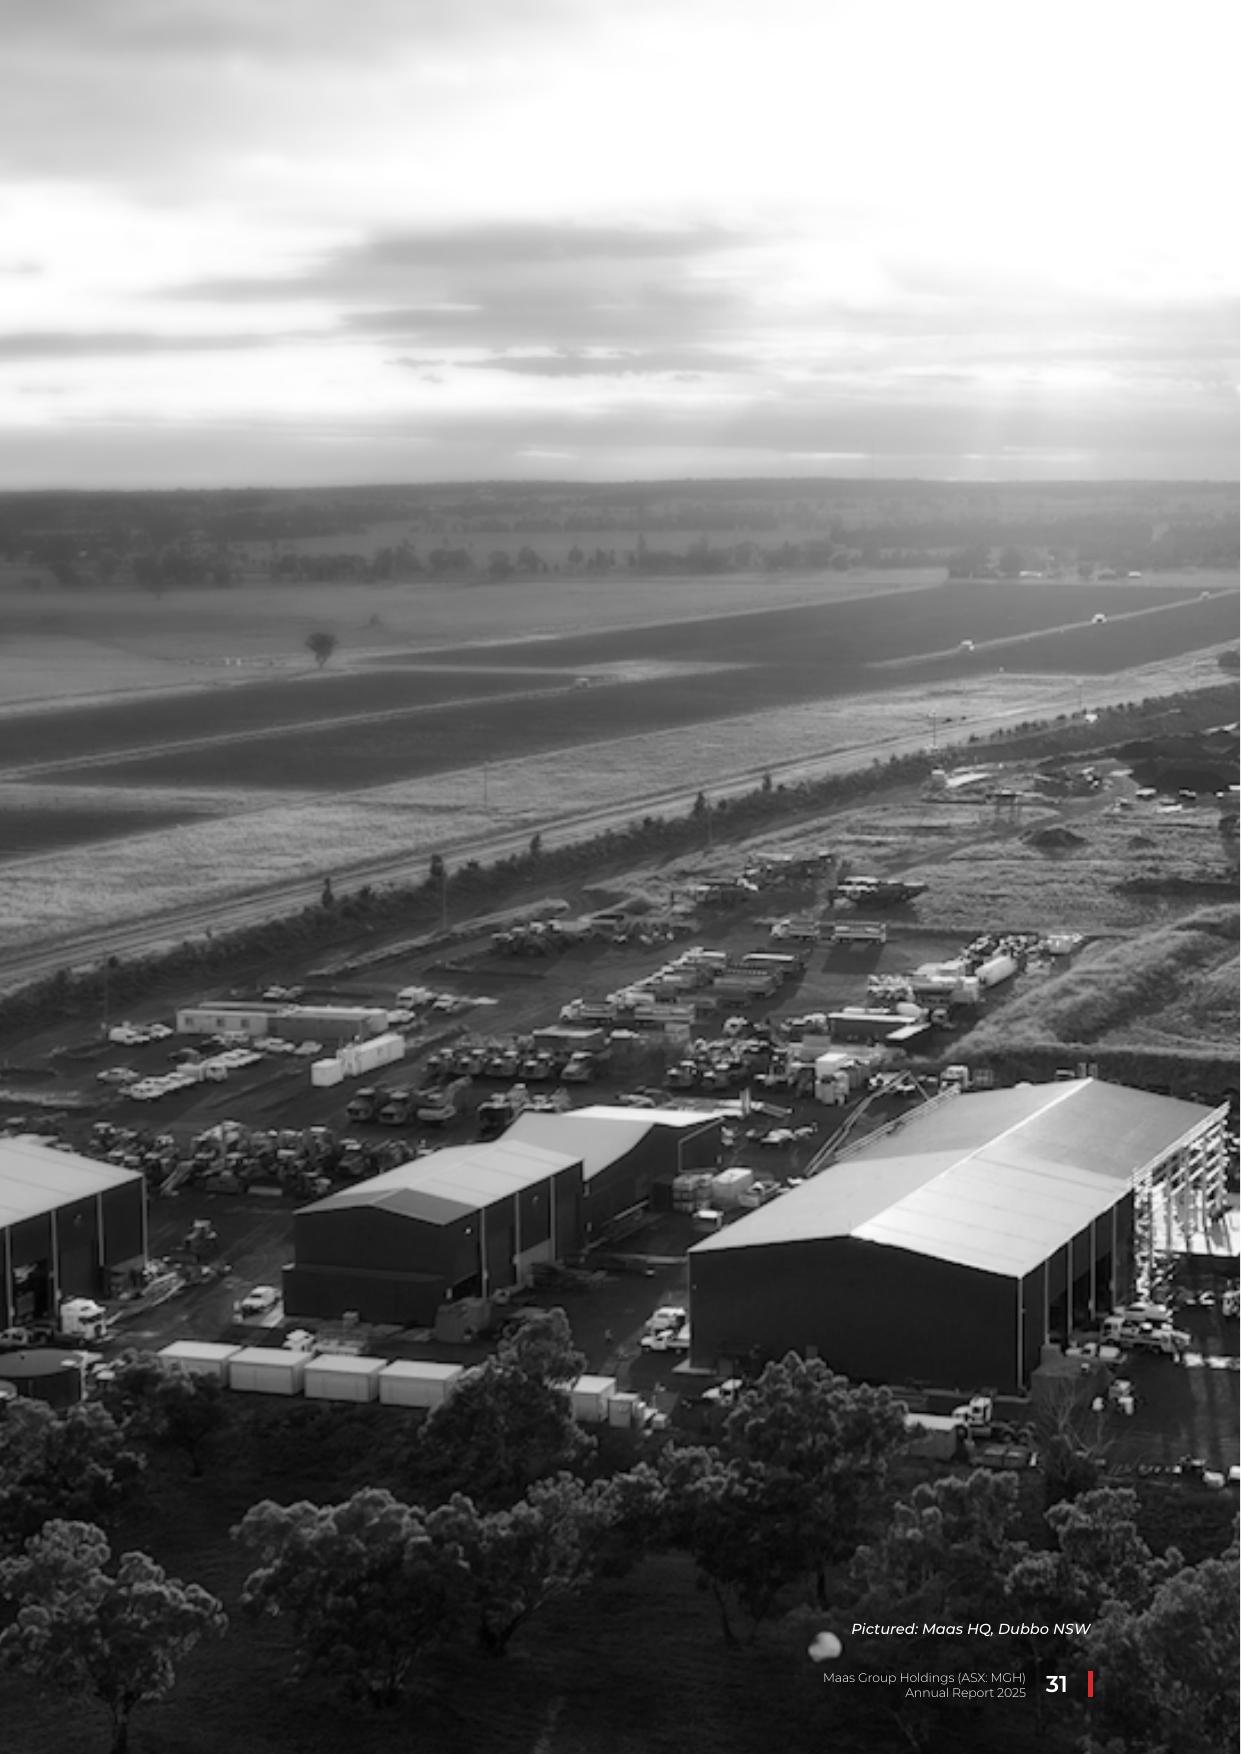
Sources: FY2025 Annual Report (pp. 5, 13-16, 52-53, 92 and 168)
MAAS has grown quickly, but leverage, acquisition activity and non-cash property gains make earnings quality as important as growth.
Sources: FY2025 Annual Report (pp. 5, 13-16, 52-53, 92 and 168) · FMP market snapshot (Data frozen 28 July 2026)
Revenue grew faster than EBITDA, causing the underlying EBITDA margin to decline from 20.7% to 19.0%. Operating cash flow improved materially, but property inventories and investment activity remain important uses of capital.
| Metric | H1 FY2025 | H1 FY2026 | Change |
|---|---|---|---|
| Statutory Revenue | A$473.9m | A$639.3m | +34.9% |
| Underlying Revenue | A$458.5m | A$607.7m | +32.5% |
| Underlying EBITDA | A$95.0m | A$115.3m | +21.4% |
| Statutory NPAT to owners | A$31.3m | A$37.9m | +21.1% |
| Net operating cash flow | A$(3.3)m | A$37.0m | Improved |
| H1 FY2026 item | A$m | Interpretation |
|---|---|---|
| Underlying net debt | 639.6 | Starting point for pro-forma transaction cash |
| Cash | 93.3 | Reported cash at 31 December 2025 |
| Total equity | 922.7 | Includes A$10.7m non-controlling interest |
| Investment properties | 278.3 | Fair-value carrying amount |
| Property held for sale | 39.4 | Current asset |
| Inventories | 281.2 | Current and non-current, including development inventory |
MAAS reports statutory and underlying measures. In FY2025, underlying Revenue was A$42.7m below statutory Revenue because the company excluded Revenue attributable to non-controlling interests. Underlying NPAT was A$6.5m above statutory NPAT to owners. H1 FY2026 showed a smaller A$2.7m NPAT adjustment.
The largest analytical issue is Commercial Real Estate fair-value income. We retain official underlying EBITDA for historical comparison, but separate fair-value gains from recurring OpCo earnings in valuation. This prevents a non-cash revaluation from receiving the same multiple as contracted electrical work.
| Period | Statutory Revenue | Underlying Revenue | Statutory NPAT | Underlying NPAT |
|---|---|---|---|---|
| FY2025 | A$1,040.0m | A$997.4m | A$72.0m | A$78.5m |
| H1 FY2026 | A$639.3m | A$607.7m | A$37.9m | A$40.6m |
Sources: FY2025 Annual Report (pp. 5, 13-16, 52-53, 92 and 168) · H1 FY2026 Report (pp. 2, 8-11, 23 and 30)
The model is driver-based and perimeter-aware. It does not extrapolate the current group after a major disposal.
Segment Revenue
Prior Revenue × (1 + volume + price/mix + contract ramp + acquisition/disposal effect)
Adjusted EBITDA
Continuing segment Revenue × segment margin + separately modeled fair-value gains - central costs
Adjusted EPS
[(EBITDA - D&A + net interest) × (1 - tax rate) - NCI adjustment] ÷ diluted shares
FCFF
EBIT × (1 - tax rate) + D&A - capex - change in working capital
SOTP equity value
Post-sale net cash + residual OpCo value + property value + Firmus stake value
The full-year estimate is not a black box. It requires A$149.7m of H2 EBITDA and A$57.4m of H2 underlying NPAT to owners. Those figures can be checked directly against the August result.
| Metric | H1 actual | Implied H2 | FY2026 estimate |
|---|---|---|---|
| Underlying Revenue | A$607.7m | A$762.3m | A$1,370.0m |
| Underlying EBITDA | A$115.3m | A$149.7m | A$265.0m |
| Underlying NPAT to owners | A$40.6m | A$57.4m | A$98.0m |
| Adjusted EPS | A$0.112 | A$0.156 | A$0.268 |
Sources: H1 FY2026 Report (pp. 2, 8-11, 23 and 30) · 18 May 2026 Corporate Update (pp. 1-3)
Civil and electrical plus Manufacturing and central costs form the residual OpCo multiple. Residential and Commercial are captured primarily through property NAV to avoid double-counting. Commercial fair-value gains remain in reported underlying EBITDA but are excluded from the OpCo valuation base.
| Component | Revenue | EBITDA | Valuation treatment |
|---|---|---|---|
| Civil and electrical | A$560.0m | A$105.0m | OpCo multiple |
| Residential property | A$120.0m | A$27.0m | Property asset value |
| Commercial property cash earnings | A$125.0m | A$15.0m | Property asset value |
| Commercial property fair-value gains | A$0.0m | A$15.0m | Excluded from OpCo multiple |
| Manufacturing | A$38.0m | A$6.0m | OpCo multiple |
| Corporate and eliminations | A$-43.0m | A$-12.0m | OpCo multiple |
Sources: FY2025 Annual Report (pp. 5, 13-16, 52-53, 92 and 168) · H1 FY2026 Report (pp. 2, 8-11, 23 and 30) · 18 May 2026 Corporate Update (pp. 1-3)
| Rule | Implementation |
|---|---|
| No lookahead | Only information available by 28 July 2026 is used |
| Official-source precedence | Company filings override provider statement values |
| No pipeline-as-backlog | Only the A$200m Firmus contract enters base Revenue |
| No gross-proceeds shortcut | Debt, leakage and invested cash are separately bridged |
| No property double-count | Property divisions use NAV rather than OpCo EBITDA multiple |
| Owner basis | Underlying NPAT is modeled for ordinary shareholders; no incremental NCI deduction is added |
| Write-once inputs | The run ID hashes the config, curated inputs, market manifest and three official PDFs |
| Human approval | The target and rating remain analyst judgments |
Sources: FY2025 Annual Report (pp. 5, 13-16, 52-53, 92 and 168) · H1 FY2026 Report (pp. 2, 8-11, 23 and 30) · 18 May 2026 Corporate Update (pp. 1-3) · FMP market snapshot (Data frozen 28 July 2026)
FY2026 is anchored to guidance; FY2027 is a transition year; later years represent the continuing company.
| A$m except EPS | FY26 | FY27 | FY28 | FY29 | FY30 |
|---|---|---|---|---|---|
| Continuing Revenue | 690.0 | 800.0 | 896.0 | 976.6 | 1,045.0 |
| Disposed Materials Revenue | 680.0 | 230.0 | 0.0 | 0.0 | 0.0 |
| Group underlying Revenue | 1,370.0 | 1,030.0 | 896.0 | 976.6 | 1,045.0 |
| Group underlying EBITDA | 265.0 | 204.0 | 192.6 | 214.9 | 232.0 |
| Adjusted NPAT to owners | 98.0 | 88.2 | 107.4 | 123.3 | 136.2 |
| Adjusted EPS | A$0.268 | A$0.241 | A$0.294 | A$0.337 | A$0.372 |
| Continuing FCFF | 27.8 | 61.9 | 83.7 | 96.6 | 106.2 |
Sources: FY2025 Annual Report (pp. 5, 13-16, 52-53, 92 and 168) · H1 FY2026 Report (pp. 2, 8-11, 23 and 30) · 18 May 2026 Corporate Update (pp. 1-3)
This is a constrained liquidity bridge, not a prediction that MAAS will sit on cash. It starts from modeled post-settlement net cash and deducts a 7-cent annual ordinary dividend. Acquisitions, special distributions and unsigned Firmus projects are deliberately left at zero until announced.
| FY | Opening net cash | Continuing FCFF | Ordinary dividends | Closing net cash |
|---|---|---|---|---|
| 2027 | A$774.7m | A$61.9m | A$25.6m | A$811.1m |
| 2028 | A$811.1m | A$83.7m | A$25.6m | A$869.2m |
| 2029 | A$869.2m | A$96.6m | A$25.6m | A$940.2m |
| 2030 | A$940.2m | A$106.2m | A$25.6m | A$1,020.8m |
Sources: 18 May 2026 Corporate Update (pp. 1-3) · H1 FY2026 Report (pp. 2, 8-11, 23 and 30)
FY2027 onward is not a clean like-for-like comparison because current provider consensus may include a different number of Materials trading months or a different discontinued-operations presentation. We retain it as a reasonableness check, not as the forecast target.
| FY | Consensus Revenue | Our headline Revenue | Consensus EBITDA | Our EBITDA | Consensus EPS | Our EPS |
|---|---|---|---|---|---|---|
| 2026 | A$1,371.5m | A$1,370.0m | A$309.8m | A$265.0m | A$0.281 | A$0.268 |
| 2027 | A$1,296.0m | A$1,030.0m | A$292.7m | A$204.0m | A$0.311 | A$0.241 |
| 2028 | A$1,239.2m | A$896.0m | A$279.9m | A$192.6m | A$0.364 | A$0.294 |
| 2029 | A$1,524.8m | A$976.6m | A$344.4m | A$214.9m | A$0.374 | A$0.337 |
The model produces continuing FCFF of about A$62m in FY2027 and A$84m in FY2028 before discretionary acquisitions or major new Firmus site investment. The path improves as residual margins normalize and interest expense falls, but property inventory and electrical working capital can absorb cash before Revenue is collected.
We will judge forecast quality using receipts, contract assets, inventory, capex and realized property proceeds rather than EBITDA alone. The sale itself is a financing event, not operating cash flow.
A$5.70 blends a true no-deal case with two completion cases. SOTP is primary; DCF and peer multiples are cross-checks.
| Component | A$m | A$/share | Method |
|---|---|---|---|
| Post-sale net cash | 774.7 | 2.12 | Consideration less leakage, H1 net debt and Firmus cash outflow |
| Residual OpCo | 742.5 | 2.03 | A$99m EBITDA at 7.5x |
| Property | 479.1 | 1.31 | A$598.8m gross accounting reference at a 20% discount |
| Firmus minority stake | 100.0 | 0.27 | Cost reference |
| Base equity value | 2,096.3 | 5.73 | Sum of the parts |
| Probability-weighted target | - | 5.70 | 15% no deal / 60% base / 25% favourable |
Sources: 18 May 2026 Corporate Update (pp. 1-3) · H1 FY2026 Report (pp. 2, 8-11, 23 and 30)
| Scenario | Net cash | OpCo value | Property | Firmus | Value/share |
|---|---|---|---|---|---|
| Transaction does not complete | A$-739.6m | A$1,855.0m | A$0.0m | A$65.0m | A$3.23 |
| Base completion case | A$774.7m | A$742.5m | A$479.1m | A$100.0m | A$5.73 |
| Favourable completion case | A$861.2m | A$1,062.0m | A$539.0m | A$125.0m | A$7.08 |
Sources: 18 May 2026 Corporate Update (pp. 1-3) · H1 FY2026 Report (pp. 2, 8-11, 23 and 30)
The DCF is deliberately limited to the residual operating businesses. Property and the Firmus stake remain outside it, which avoids counting the same assets twice. Terminal value is 77% of DCF enterprise value, so this remains a sensitivity check rather than a precise answer.
| Method | Value | Interpretation |
|---|---|---|
| SOTP residual OpCo | A$742.5m | A$99m FY2027 EBITDA at 7.5x |
| Residual OpCo DCF | A$779.3m | 10.0% WACC and 2.5% terminal FCFF growth |
| DCF premium to SOTP | 5.0% | A modest cross-check, not a second valuation added to the target |
| WACC | 2.0% g | 2.5% g | 3.0% g |
|---|---|---|---|
| 9.0% | A$847m | A$902m | A$966m |
| 10.0% | A$739m | A$779m | A$826m |
| 11.0% | A$655m | A$686m | A$720m |
This reverse calculation is conditional on the base completion bridge. On those assumptions, the market is valuing the residual OpCo below our 7.5x SOTP multiple and implies slightly negative terminal FCFF growth. The apparent discount disappears quickly if the sale does not complete or property realization is weaker.
| Measure | Implied by A$5.19 |
|---|---|
| Residual OpCo value after base cash, property and Firmus | A$543.7m |
| Residual EV/EBITDA | 5.5x |
| Terminal FCFF growth at 10% WACC | -1.8% |
Sources: FMP market snapshot (Data frozen 28 July 2026) · 18 May 2026 Corporate Update (pp. 1-3) · H1 FY2026 Report (pp. 2, 8-11, 23 and 30)
The completion-case value is not robust to every assumption. At A$99m of residual EBITDA, moving from 8.5% to 12.0% leakage reduces value by about A$0.16 per share. Moving the OpCo multiple by 1.5x changes value by about A$0.41 per share.
| EV/EBITDA | 6.0% leakage | 8.5% leakage | 12.0% leakage |
|---|---|---|---|
| 6.00x | A$5.44 | A$5.33 | A$5.17 |
| 6.75x | A$5.64 | A$5.53 | A$5.37 |
| 7.50x | A$5.85 | A$5.73 | A$5.58 |
| 8.25x | A$6.05 | A$5.94 | A$5.78 |
| 9.00x | A$6.25 | A$6.14 | A$5.98 |
The screened peer median EV/EBITDA is 12.7x. We use 7.5x for residual MAAS because the peer set contains higher-quality, less property-intensive and often net-cash contractors, while MAAS still faces transaction, customer concentration and capital-allocation risk. The peer table is a cross-check, not the primary method.
| Ticker | Company | EV/EBITDA | P/E | Net debt/EBITDA | ROIC |
|---|---|---|---|---|---|
| MGH.AX | MAAS Group Holdings Limited | 12.0x | 24.7x | 3.2x | 4.6% |
| GNP.AX | GenusPlus Group Limited | 19.2x | 34.1x | -0.9x | 16.8% |
| IPG.AX | IPD Group Limited | 11.8x | 19.0x | 1.3x | 11.7% |
| NWH.AX | NRW Holdings Limited | 12.7x | 66.0x | 0.9x | 4.8% |
| VNT.AX | Ventia Services Group Limited | 10.1x | 18.2x | 1.3x | 20.2% |
| DOW.AX | Downer EDI Ltd | 9.9x | 32.9x | 1.5x | 5.8% |
| MND.AX | Monadelphous Group Limited | 16.8x | 27.3x | -1.3x | 14.4% |
| SVW.AX | Seven Group Holdings Limited | 13.9x | 36.3x | 3.1x | 10.4% |
The key risks are measurable: completion, leakage, residual earnings, property realization and capital allocation.
| Scenario | Operating outcome | Transaction outcome | Value/share |
|---|---|---|---|
| No deal | Current consolidated group remains intact | No proceeds; adjusted net debt remains | A$3.23 |
| Base | Launceston completes; residual OpCo EBITDA A$99m | 60% contingent probability; 8.5% leakage | A$5.73 |
| Favourable | Repeat electrical scope and stronger property realization; A$118m OpCo EBITDA | Full contingent consideration; 6% leakage | A$7.08 |
These are one-factor tests around the central case, not probabilities of loss and not amounts to add together. Transaction failure and excess leakage overlap; electrical delay and civil execution can also occur together. The scenario table remains the appropriate combined downside framework.
| Risk | Prob. | Impact | Valuation test | Downside/share | Monitor |
|---|---|---|---|---|---|
| Construction Materials transaction fails or is materially delayed | Medium | High | Target less the consolidated-group no-deal value | A$2.47 | Regulatory approvals, shareholder documentation and settlement notice |
| Transaction leakage is five percentage points above base | Medium | Medium | Five percentage points of base gross consideration divided by diluted shares | A$0.23 | Scheme/transaction documents and completion accounts |
| The secured Launceston electrical contract is delayed or delivers below the modeled margin | Medium | High | A$15m residual EBITDA at the base 7.5x multiple | A$0.31 | Launceston completion, commissioning and signed site-level scope |
| Property carrying values or settlement rates weaken | Medium | Medium | 10% haircut to gross property reference | A$0.16 | Lot settlements, development pipeline, cap rates and asset recycling |
| Capital is redeployed below the cost of capital | Medium | High | A$500m deployed at 6% versus a 10% required return, capitalized at the 10% hurdle | A$0.55 | Use-of-proceeds framework, hurdle rates, acquisitions and distributions |
| Project, weather and execution losses recur | Medium | Medium | 10% reduction in residual OpCo EBITDA | A$0.20 | Project margin commentary, claims, utilization and contract mix |
Sources: FY2025 Annual Report (pp. 5, 13-16, 52-53, 92 and 168) · H1 FY2026 Report (pp. 2, 8-11, 23 and 30) · 18 May 2026 Corporate Update (pp. 1-3)
| Catalyst | Window | Evidence required |
|---|---|---|
| FY2026 result and FY2027 guidance | August 2026 | EBITDA within A$250-280m guidance and transparent continuing/discontinued bridge |
| Heidelberg transaction approval and settlement | Q3-Q4 CY2026 | Net proceeds, leakage, debt reduction and use-of-proceeds policy |
| Launceston AI Factory commissioning | CY2026 | Completion, recognized revenue, margin and cash conversion |
| Additional signed Firmus site scope | Next several reporting periods | Binding contract value, capacity, delivery timing and economics |
| Capital return or disciplined reinvestment | After transaction settlement | Board-approved allocation with explicit hurdle rates |
| Residential and commercial asset recycling | FY2027 | Cash proceeds, realized margins and reduction in capital intensity |
A transaction update first changes the net-cash compartment: consideration probability, leakage and timing. A Firmus award changes the electrical Revenue schedule, margin, working capital and potentially the residual multiple, but only after the signed scope is validated. A property sale changes cash realization and NAV, not just reported Revenue.
We do not infer causality from a one-day share-price move. Event-window returns can show whether the market reacted, but financial forecast revisions require an identified business mechanism and a dated assumption change. The report should therefore be versioned at each material event rather than silently rewritten.
After the sale, stewardship of the balance sheet becomes more important than the disposal headline.
The first call on proceeds should be transaction costs, tax, retained liabilities and debt reduction. The second should be already committed capital, including the A$100m Firmus investment. Remaining cash should be evaluated against explicit hurdle rates and downside liquidity needs. In our view, a residual cash buffer plus a mix of shareholder return and contract-backed electrical investment would provide the clearest evidence of discipline.
The A$1.18bn syndicated facility increases liquidity but is not itself value creation. Likewise, the Western Sydney Aerotropolis facility should be assessed on net economic exposure: MAAS disclosed an up-to-A$625m secured loan supported by limited-recourse back-to-back funding. Gross facility size should not be presented as owned property or Revenue.
| Question | Why it matters |
|---|---|
| What is the final net cash after completion accounts? | Determines distributable and deployable value |
| What return hurdles apply to Firmus and new projects? | Tests whether growth exceeds the cost of capital |
| How will performance be reported after the disposal? | Prevents perimeter confusion |
| What limits apply to acquisitions and leverage? | Controls reinvestment and balance-sheet risk |
| What proportion of electrical backlog is fixed price? | Clarifies margin and working-capital exposure |
Sources: FY2025 Annual Report (pp. 5, 13-16, 52-53, 92 and 168) · 18 May 2026 Corporate Update (pp. 1-3)
W & E MAAS held 49.50% of ordinary shares at 11 August 2025. That alignment can support long-term decision-making, but it also gives minority shareholders less influence over major capital-allocation choices. The post-sale use of proceeds, related-party governance and acquisition discipline therefore deserve close attention.
Sources: FY2025 Annual Report (pp. 5, 13-16, 52-53, 92 and 168)
The FY2025 final dividend and H1 FY2026 interim dividend were each 3.5 cents per share and fully franked. We use 7.0 cents as the next-12-month ordinary-dividend assumption, equal to a 1.35% yield at A$5.19. It is an explicit run-rate assumption, not company guidance.
No special distribution is included. Any transaction-related capital return remains upside only after settlement, tax, retained liabilities and liquidity needs are known.
Sources: FY2025 Annual Report (pp. 5, 13-16, 52-53, 92 and 168) · H1 FY2026 Report (pp. 2, 8-11, 23 and 30) · FMP market snapshot (Data frozen 28 July 2026)
MAAS's operating footprint creates safety, environmental, community and land-development obligations. For valuation, the most immediate transmission channels are project stoppages, remediation, approvals, insurance, weather resilience and access to customers. We do not assign a generic ESG premium or discount.
Sources: FY2025 Annual Report (pp. 5, 13-16, 52-53, 92 and 168)
Every material figure is classified as fact, calculation, assumption or judgment; known gaps remain visible.
| Layer | Treatment |
|---|---|
| Official facts | ASX/company reports and announcements are primary |
| Provider data | FMP is used for price, consensus and peer cross-checks |
| Derived calculations | Formula outputs reconcile to frozen inputs |
| Forecast assumptions | Explicit and scenario-tested; not described as facts |
| Analyst judgment | Rating, target, multiples and probabilities reflect scenario-sensitive analyst judgment |
| Unknowns | Final transaction leakage, follow-on Firmus scope and private contracts remain unknown |
Sources: FY2025 Annual Report (pp. 5, 13-16, 52-53, 92 and 168) · H1 FY2026 Report (pp. 2, 8-11, 23 and 30) · 18 May 2026 Corporate Update (pp. 1-3) · FMP market snapshot (Data frozen 28 July 2026)
The table carries the prior-year actual forward as a deliberately simple benchmark. It is useful for checking whether MAAS's historical growth made static forecasts unreliable, but it is not a backtest of this initiation model. No historical point-in-time version of the current forecast exists, so the report makes no predictive-accuracy claim.
| FY | Metric | Naive forecast | Actual | Absolute error |
|---|---|---|---|---|
| 2024 | Statutory Revenue | A$789.3m | A$895.1m | 11.8% |
| 2024 | EBITDA | A$159.5m | A$200.0m | 20.3% |
| 2025 | Statutory Revenue | A$895.1m | A$1,030.5m | 13.1% |
| 2025 | EBITDA | A$200.0m | A$207.7m | 3.7% |
Sources: FY2025 Annual Report (pp. 5, 13-16, 52-53, 92 and 168) · FMP market snapshot (Data frozen 28 July 2026)
| Source | Locator | Role | Status | Limitation |
|---|---|---|---|---|
| MAAS Group FY2025 Annual Report | pp. 5, 13-16, 52-53, 92 and 168 | direct | available | Company disclosure; non-IFRS underlying measures require reconciliation. |
| MAAS Group H1 FY2026 Report | pp. 2, 8-11, 23 and 30 | direct | available | Six-month actuals; second-half seasonality and transaction effects remain estimates. |
| MAAS Group Corporate Update, 18 May 2026 | pp. 1-3 | direct | available | Forward-looking management statements are assumption anchors, not actual results. |
| JLE Group official company page | Company profile and capabilities | direct | available | Company description; project economics require contract-level evidence. |
| Financial Modeling Prep | Frozen profile, price, estimates, statements and key-metrics payloads | cross_check | available | Provider data is supporting evidence and must not override official filings. |
| Argus MGH company-twin snapshot | Accepted graph release mgh_au_v3_20260723_refined2 | supporting | available | Used for structured discovery and cross-reference; report facts retain primary-source citations. |
| Historical point-in-time consensus archive | Not licensed for this POC | gap | known_gap | Not available in the POC; current consensus is context only. |
| Infrastructure Australia 2025 Infrastructure Market Capacity Report | National five-year construction activity and public infrastructure pipeline | independent_context | available | Market-wide outlook; it is not MAAS-specific backlog. |
| ABS Construction Work Done, March quarter 2026 | Key statistics and March quarter 2026 tables | independent_context | available | National activity indicator; not a direct MAAS revenue forecast. |
| ABS Engineering Construction Activity, March quarter 2026 | South Australia and national work-done tables | independent_context | available | Broad activity indicator; project mix differs from MAAS. |
| ABS Building Approvals, May 2026 | May 2026 dwelling and value-of-building approvals | independent_context | available | Monthly approvals are volatile and lead construction with uncertain timing. |
| Reserve Bank of Australia cash-rate target | Cash-rate target effective 17 June 2026 | independent_context | available | Policy-rate context; MAAS debt pricing depends on facility terms and hedging. |
| AEMO 2026 Integrated System Plan | 2026 ISP overview and network investment roadmap | independent_context | available | System-wide roadmap; it does not identify MAAS contract awards. |
| Frozen MGH FMP snapshot | Immutable raw payload manifest and endpoint-level JSON files | cross_check | available | Point-in-time provider snapshot; current consensus is not historical consensus. |
Sources: FY2025 Annual Report (pp. 5, 13-16, 52-53, 92 and 168) · H1 FY2026 Report (pp. 2, 8-11, 23 and 30) · 18 May 2026 Corporate Update (pp. 1-3) · FMP market snapshot (Data frozen 28 July 2026)
Underlying measures are non-IFRS metrics defined by MAAS and reconciled in company reports. Adjusted EPS in this report excludes transaction gains and one-off costs. Continuing Revenue excludes the divested Materials business after the modeled settlement point. OpCo EBITDA excludes Residential, Commercial property earnings and fair-value gains because those assets are valued through NAV.
The SOTP is sensitive to undisclosed tax, fees, working-capital adjustments, retained liabilities and use of proceeds. The A$598.8m property reference is a gross accounting measure, not a project-level NAV. The Firmus stake is unlisted and valued at cost in the base case. Current consensus is point-in-time context; a historical consensus archive was unavailable.
The rating policy requires total return of at least 17.5% for a BUY: a 15% house threshold plus a 2.5 percentage-point promotion buffer. The current 11.2% modeled return therefore remains HOLD (High Risk).
This is an illustrative independent research study prepared from public and licensed information available at the stated cut. It is not personal investment advice, a regulated research recommendation or an offer to transact. No analyst certification or claim of regulatory independence is made.
Forecasts and valuations can change materially when completion terms, FY2026 results or capital-allocation decisions become known. The target and rating remain subject to named human analyst approval before any use in regulated research.